Whether a resolution and refresh rate combination fits through a DisplayPort link depends on more than “resolution × refresh × bits per pixel.” That formula gets you close, but the real bandwidth requirement includes blanking intervals that vary by device, and the actual usable capacity of a link is meaningfully less than its advertised raw number once encoding overhead is accounted for.
Four things that determine bandwidth, not one
- Pixel timing — the actual pixel clock a mode uses, which includes horizontal and vertical blanking intervals in addition to the visible image. This is not derivable from resolution and refresh rate alone.
- Color format and bit depth — RGB and 4:4:4 chroma use 3× the bit depth per pixel; 4:2:2 uses 2×; 4:2:0 uses 1.5×. A 10-bit HDR signal has 25% more data per pixel than 8-bit before anything else changes.
- Encoding overhead — a link’s advertised raw bandwidth isn’t what reaches the display. DisplayPort’s 8b/10b encoding (used through DP 1.4) has a fixed 20% overhead; DisplayPort 2.0/2.1’s newer 128b/132b-based encoding is far more efficient, at roughly 3.3% overhead once forward error correction is accounted for.
- Compression — whether DSC is available across the whole chain to reduce the requirement when it doesn’t fit uncompressed.
Why pixel timing isn’t just resolution × refresh
Every display mode includes blanking — extra rows and columns of “pixels” the signal sends that aren’t part of the visible image, left over from CRT-era timing requirements that modern digital displays still use. The exact blanking a specific mode uses depends on which timing standard is applied, and that can genuinely differ between two monitors at the identical resolution and refresh rate. A published example: a monitor with an official 3840×2160@60 pixel clock of 533.25 MHz over DisplayPort uses meaningfully less blanking than the CTA-861 standard timing (594.0 MHz) that the same resolution and refresh rate commonly uses over HDMI — a roughly 11% difference in actual required bandwidth for what looks, on a spec sheet, like the same mode.
This is why CompatSense’s engine never derives a pixel clock from resolution and refresh rate alone when it can use a manufacturer-verified figure instead, and why the Bandwidth Calculator clearly labels every result as either an exact, sourced timing or a standard-derived estimate — never presenting an estimate as if it were a verified number.
Worked examples
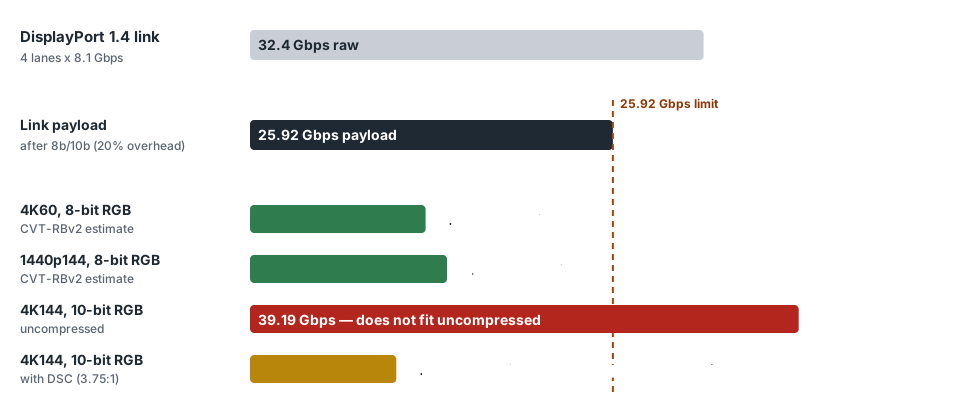
These figures are outputs of CompatSense’s Bandwidth Calculator, not illustrative round numbers, and you can reproduce each one there. They use standard-derived timings (CVT-RBv2), so they are estimates rather than the verified timing of a specific monitor.
| Mode | Required, uncompressed | DP 1.4 payload (25.92 Gbps) | DP 2.0/2.1 payload (77.36 Gbps) |
|---|---|---|---|
| 2560×1440@144, 8bpc RGB | 14.08 Gbps | Fits | Fits |
| 3840×2160@60, 8bpc RGB | ≈12.5 Gbps (estimate) | Fits | Fits |
| 3840×2160@144, 10bpc RGB (HDR) | 39.19 Gbps | Doesn’t fit uncompressed — needs DSC (10.45 Gbps compressed, fits) | Fits uncompressed |
The 4K144 HDR case is the clearest illustration of why the DisplayPort version matters beyond a bigger number on a spec sheet: DisplayPort 1.4 physically cannot carry that signal uncompressed, at all — it needs DSC to fit, which requires DSC support across the entire chain, not just on the cable. DisplayPort 2.0/2.1’s higher raw capacity carries the identical signal with no compression required.
Why the newer encoding is more than “a bigger number”
DisplayPort 1.4’s 8b/10b encoding spends a fixed 20% of every link’s raw capacity on encoding overhead by mathematical definition of the scheme — no implementation improves on that. DisplayPort 2.0/2.1 moved to a more efficient encoding, and its real-world overhead (including forward error correction) works out to roughly 3.3% rather than the naive ~3% you’d get from the encoding scheme’s bit-packing ratio alone — a small but real difference in the actual payload you get out of an 80 Gbps raw link. That efficiency gain is a genuine part of why DisplayPort 2.1 monitors can reach 4K120/144 and beyond without leaning on compression the way DisplayPort 1.4 has to.
The 3.3% overhead figure specifically applies to DisplayPort 2.1’s highest link-rate tier (UHBR20, 80 Gbps). DisplayPort 2.0/2.1 actually defines several link-rate tiers below that, and this figure shouldn’t be assumed to apply uniformly to a lower tier without separate verification — a genuinely common oversimplification in bandwidth calculators we reviewed while researching this page.
Enter your own resolution, refresh rate, and color depth to see the real required bandwidth, DSC-compressed figure, and how it compares against real transport links.
Open the bandwidth calculatorSources
- DisplayPort 1.4 / DisplayPort 2.1 specifications
- A Guide to DisplayPort 2.1 (and previously 2.0)
- VESA CVT (Coordinated Video Timings) Standard, Version 1.2
- Manufacturer pixel-clock tables (e.g. Dell U2723QE User’s Guide)